In June, the International Energy Agency (IEA) published its Global Critical Minerals Outlook 2024. The executive summary that precedes the publication makes an emphasis on the future prospects for the markets of key energy transition minerals. More interesting, however, seems to be the last-year market review that details the data from, and processes in, the metal consuming sectors (wind and solar energy, battery industry, etc.) and metal markets.
According to the IEA, energy transition minerals include lithium, cobalt, graphite and nickel (used for the production of energy storage systems), copper (cables and power grids), and rare earth elements (REEs, needed for wind turbine engines, electric vehicles and other high-tech applications).
End market trends
This section is intriguing because it describes events that have already taken place and are, therefore, the only reliable basis for an independent forecast. Data shows that energy transition pathways are anything but easy and often directly dependent on government support measures, such as tax breaks, subsidies, streamlined permitting processes, etc., although there are exceptions.
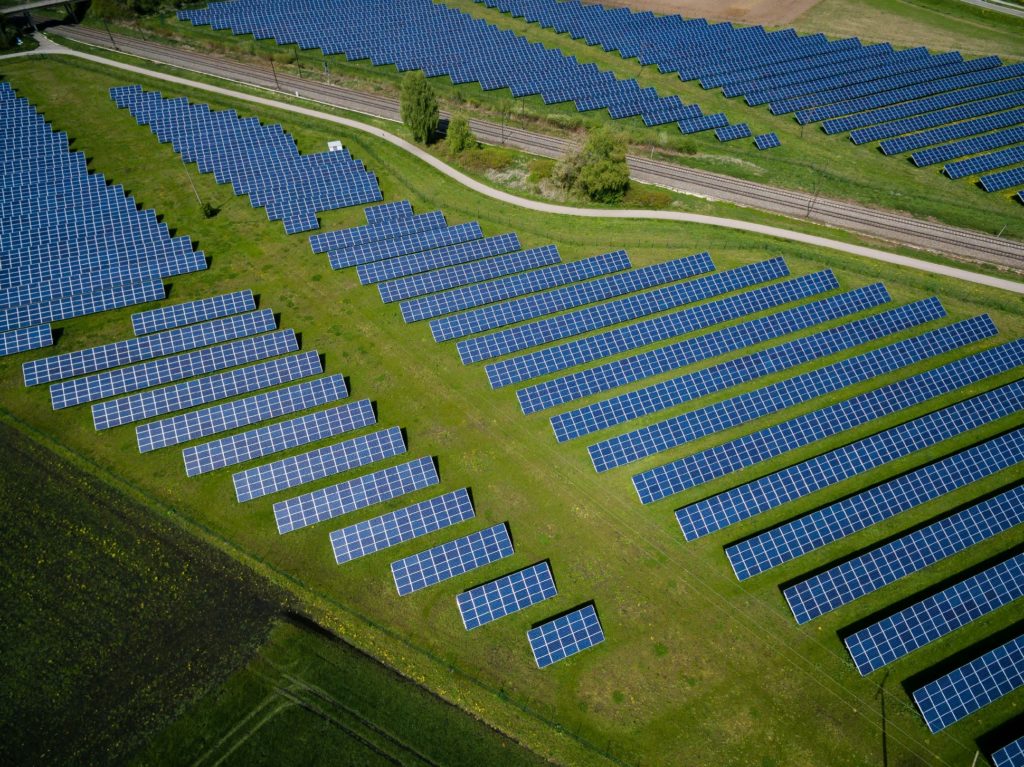
With 420 GW of new capacity installed globally in 2023, solar photovoltaic (PV) installations accounted for three quarters of renewable capacity additions worldwide. China alone accounted for 62 % of this increase despite the phase-out of government subsidies. The country commissioned as much solar PV capacity in 2023 as the rest of the world did in 2022. In the EU, solar PV additions rose by a quarter and reached a record high of 52 GW in 2023. In the US, solar capacity additions grew 50 % year-on-year following supply chain improvements, federal tax incentives, and support from state governments.
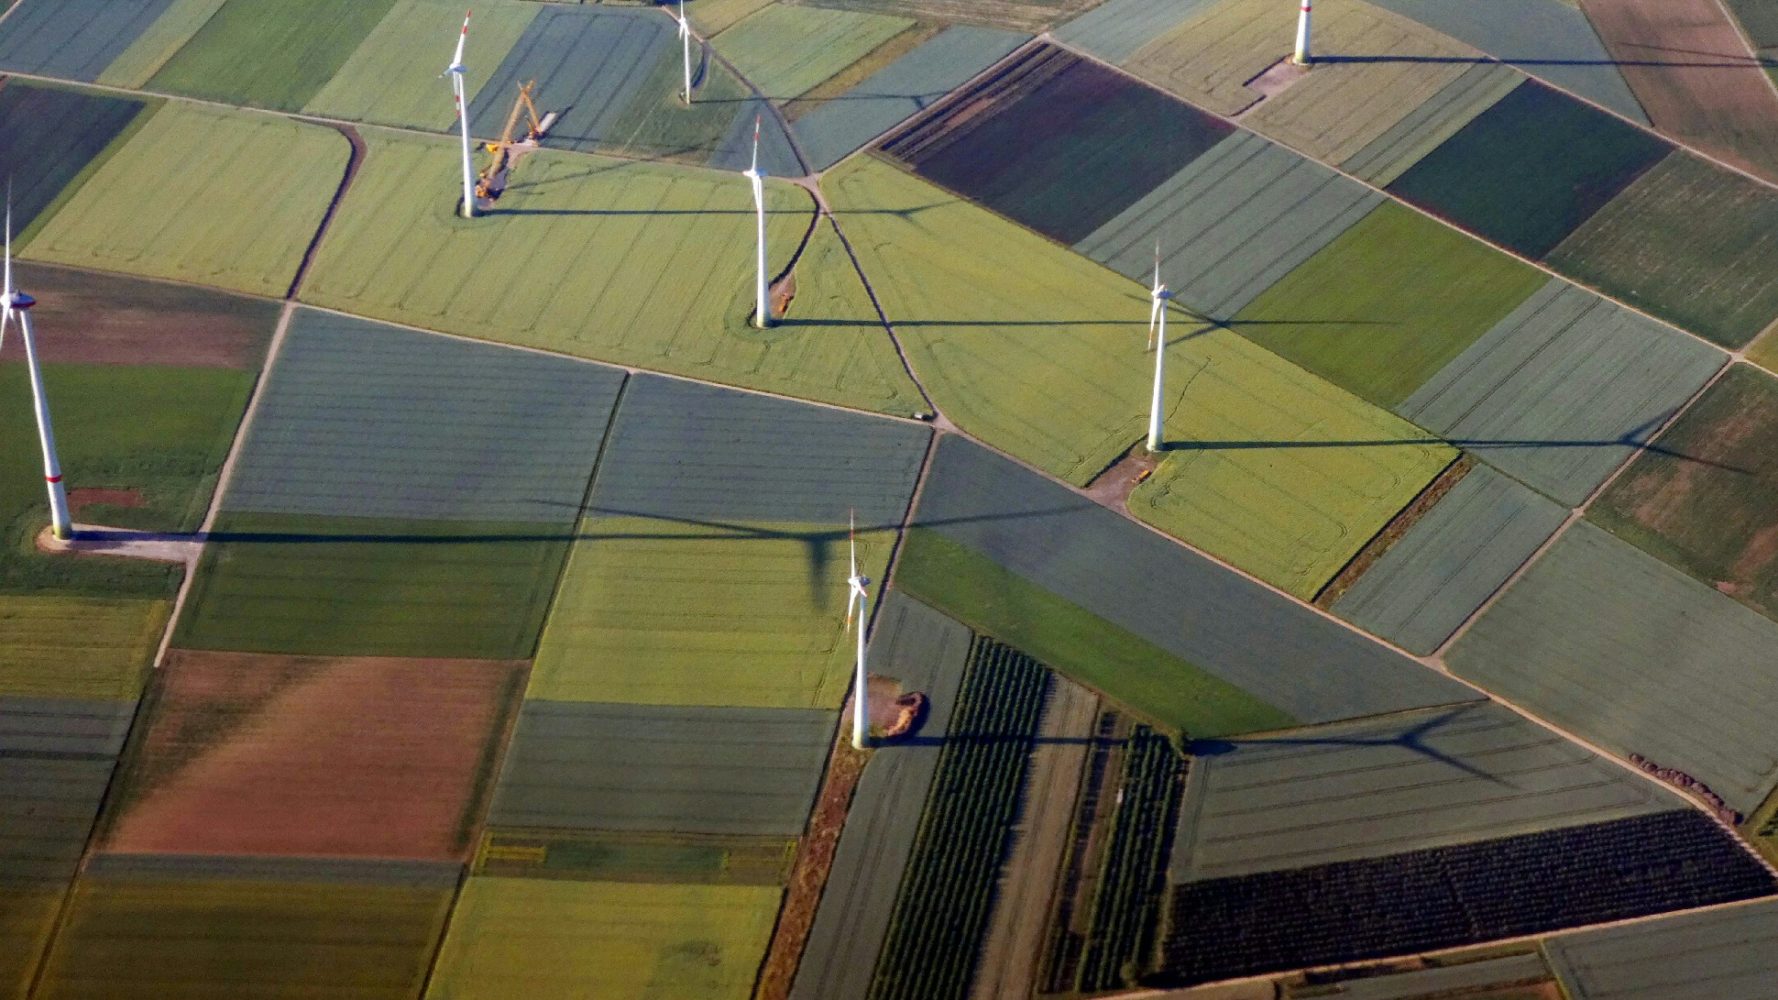
After a 20 % drop in 2022, the wind power segment showed a 60 % increase in global capacity additions nearing 120 GW, with China accounting for over 60 % of the increase. China almost doubled its capacity additions compared to 2022. In the EU, onshore wind deployment slowed down as new capacity grew by less than 10 % in 2023. “Developers have been facing multiple challenges, including rising equipment costs, inflation, and supply chain constraints, which have made them less eager to participate in competitive auctions. Most countries in Europe have introduced policies to address the challenges posed by slow and complex permitting procedures for wind projects. However, the impact of these policies will take time to be visible in deployment trends,” the survey says. In the US, wind additions declined by more than a quarter, which was mostly due to the uncertainty over the future of tax credits under the Inflation Reduction Act (IRA). IEA analysts believe that wind capacity additions will accelerate in the coming years thanks to the IRA.
Onshore wind projects accounted for over 85 % of global wind deployment in 2023. The offshore wind industry outside of China is facing challenges with investment costs, which are more than 20 % higher today than a few years ago. As a result, developers canceled or postponed 15 GW of offshore wind projects in the United States and the United Kingdom in 2023 because the previously agreed pricing no longer covered construction costs.
IEA experts assume that renewable capacity additions would accelerate significantly all over the world as more than 130 countries have announced support measures. However, high interest rates and low returns will be major challenges. Demand for copper, silicon and REEs will depend on the rate of renewable capacity deployment.
The electrolyzer segment is now also dominated by China. Back in 2020, the country accounted for less than 10 % of global capacity and ramped it up to 650 MW by the end of 2023 to operate almost half of the global electrolyzer capacity now. This transformation was fueled by the scaling up of project sizes by Chinese developers, with several projects now exceeding 100 MW in capacity. The European Union has ceded its leading position, having added only 70 MW of electrolyzer capacity in 2023. The US added more than 30 MW in the same year to become the third largest market in terms of installed capacity. “Demand uncertainty and lack of regulatory clarity, coupled with recent challenges such as inflation and slow implementation of support mechanisms are hindering faster adoption of electrolyzers in other regions,” the market survey says.
As for electric cars, their sales neared 14 million in 2023 to make 18 % of total car sales that year, up from 14 % in 2022. Almost 95 % of total EV sales were in China, Europe and the US, while China alone accounted for 60 % of the global total. At present, over a third of new cars registered in the country are electric, but the growth of electric car sales slowed down from 80 % in 2022 to 35 % in 2023 on the back of terminated purchase subsidies for electric cars. The Chinese market is now entering a phase of price competition and consolidation and taking a turn to exports. In 2023, China exported 1.2 million electric vehicles, an 80 % increase from 2022. Europe and Asia Pacific were primary export destinations. According to estimates, around 45 % of all cars sold in China in 2024 could be electric.
Europe is the second largest market for electric vehicles, accounting for 25 % of global sales or 3.2 million cars in 2023. Overall, electric car sales accelerated from 15 % in 2022 to 20 %, but the trends differed by country. In Germany, the share of EV sales fell from 30 % in 2022 to 25 % in 2023 due to the sudden termination of all subsidies, which were originally intended to be in place until the end of 2024. Sales of electric cars in other European countries increased, growing 30 % in the Netherlands, 25 % in the UK and France, and 60 % in Sweden.
In the US, electric car sales rose to 1.4 million in 2023, up 40 % from 2022, although the share of electric vehicles was only 10 % of total car sales. Sales were supported by the incentives provided by the IRA but, as noted in the survey, new guidance significantly reduced the number of electric vehicles eligible for tax credits in 2024.
EV sales across other countries of the world grew 70 % to nearly 1 million cars.
Metal market trends
In 2023, demand for energy transition minerals from energy transition technologies was higher than from other segments. For example, demand for copper grew 24 % while the total copper demand increased by as little as 3 %; demand for lithium grew 56 % against the overall growth of 30 %. The figures for nickel were 15 % and 8 %, respectively.
However, the prices for them fell as supply dominated demand, sometimes significantly, in the markets for all energy transition minerals. Lithium prices fell most dramatically by 75 %, while prices for nickel, cobalt and graphite fell by 30–40 %. Copper was the most stable, with prices remaining generally flat. “The ramp-up of new supply outpaced demand growth in the past two years. From Africa to Indonesia, and to China, new projects came online relatively quickly, adding sizable volumes to the supply pool. The remarkable increase in nickel supply from Indonesia is a notable example,” the IEA experts emphasize. As a result, the market for energy transition minerals shrank by 10 % to USD 325 billion in 2023 despite rising demand.
The authors of the survey also name the inventory accumulation as another reason for the decline in battery metal prices, driven by reduced demand for electric cars and, consequently, batteries and metals themselves as manufacturers had built up inventories to ensure production continuity and protect themselves from rising prices.
In the metals mining segment, the picture of mining countries and mine owners is generally patchy, with only nickel and cobalt production concentrated in Indonesia and the Democratic Republic of Congo, each holding a share of over 50 % and about 70 %, respectively. The processing segment is dominated by China, though, primarily in the production of graphite (about 95 %) REE (over 90 %), cobalt (over 70 %) and lithium (over 60 %). Other significant shares in the processing segment belong only to Chile (lithium, little below 30 %) and Indonesia (nickel, 37 %). Interestingly, the authors avoid mentioning China when describing the processing segment and focus on other countries as sources of supply.
Thus, the countries that stimulate the energy transition most are the ‘advanced economies’ (as they are called in the IEA survey) and China, but only the latter is fully self-sufficient on the minerals needed for energy transition. The others, on the contrary, depend on supplies from China. In the mining segment, China provides itself with necessary materials, if not geographically, but as the owner of mines at least.
Outlooks
According to the models developed by the IEA analysts, clean energy deployment will continue in each of the three scenarios presented: Stated Policies Scenario (STEPS), Announced Pledges Scenario (APS), and Net Zero Emissions by 2050 (NZE). Solar and wind farms will account for the largest share of capacity additions, the electricity grid will expand, production of electric vehicles will increase, and so will demand for batteries.
Demand for critical minerals will continue to grow, doubling by 2030 in the STEPS and being even higher in the APS. The NZE Scenario envisages it to triple by 2030 and quadruple by 2040. Lithium will show the fastest growth, with demand for it in the NZE Scenario to skyrocket ninefold by 2040. “Today’s well-supplied market may not be a good guide for the future, as demand for critical minerals continues to rise,” the authors of the survey give a warning.
Following the rising demand, the market size for energy transition minerals will also grow. According to IEA estimates, the total market value of energy transition minerals — copper, lithium, nickel, cobalt, graphite, and rare earth elements — will more than double by 2040 to reach USD 770 billion in the NZE scenario. The current estimate of the same market stands at about USD 325 billion, which is roughly equal to the size of today’s iron ore market. This is the size that will be reached by the copper market by 2040, the IEA believes.
When broken down by region, Latin America captures the largest amount of market value for mined output with around USD 120 billion by 2030. Indonesia will show the fastest growth, with the market value of its products doubling by 2030 on the back of burgeoning nickel production. In Africa, the same indicator will grow 65 % by 2030. Almost 50 % of the refining market value will be concentrated in China. Important is the reservation made by the authors of the market survey that their “analysis of announced projects shows limited progress in diversifying supply.”
Rosatom contributes to building an end-to-end production and supply chain in the lithium and REE segment, from ore mining to final products such as wind turbines and electric cars. In partnership with Nornickel, Rosatom plans to build a lithium mine at the Kolmozerskoye lithium deposit and is constructing two gigafactories for the full-cycle production of lithium-ion batteries to be installed in Russian electric cars.
Rosatom owns Lovozersky GOK producing loparite concentrate, and Solikamsk Magnesium Plant (SMP) extracting titanium, tantalum, niobium and a mixed REE concentrate from the loparite concentrate. SMP is currently working on setting up a separation process to obtain individual REE concentrates. Neodymium and praseodymium concentrates, in turn, will be used to manufacture permanent magnets. Construction of a magnet factory is also on Rosatom’s plans. Permanent magnets will be supplied, in particular, to Rosatom’s wind power division and electric car manufacturers.