The latest edition of the Red Book published by the OECD Nuclear Energy Agency and the IAEA testifies to the crisis in uranium production, with mines mothballed, production reduced and exploration rolled back. The pandemic makes the situation even worse. But since forecasts of future demand for uranium vary twofold and uranium from mines is not the only feedstock for nuclear fuel, it is not easy to assess risks of the uranium industry.
The Red Book is published twice a year. Its informal name comes from the color of its cover. The purpose of the Red Book is to accumulate and structure the information about uranium exploration, resources, reserves, mining and demand in the reporting period. The report published in December 2020 analyzes processes taking place in the uranium market in 2018–2019 and compares them with the preceding two-year period. The publication also accounts for the extraordinary processes that occurred in 2020 on the back of coronavirus pandemic. The Red Book 2020 contains surveys covering 45 countries, but only 31 of them are based on official government data. The remaining 14 surveys were prepared by the NEA and the IAEA Secretariat.
Resources
In 2019, identified recoverable resources in the highest cost category (
The cost category of up to USD 260 per kilogram of uranium includes lower-cost categories. For example, resources in the cost category of
In order to answer the practical question of how much uranium is available for reprocessing into nuclear fuel, one should use the Reasonably Assured Recoverable Resources (RAR) table and take a look at the lowest cost categories (
The lowest-cost resources (
The Reasonably Assured Recoverable Resources table says that Kazakhstan is a leader in the cost category of up to USD 40/kgU. Its resources in the category are estimated at 305.8 thousand tons. Kazakhstan is followed by Canada (296.2 thousand tons) and Brazil (184.3 thousand tons). Other countries do not have more than 50,000 tons of uranium resources in this category.
Australia remains a global leader in terms of total resources, but its reasonably assured resources declined from 1.4 to 1.28 million tons following re-estimation of resources and depletion of stockpiled ore at the Ranger Uranium Mine. In Canada, RAR grew from 592.9 to 652.2 thousand tons. “Overall decrease in identified resources in the low-cost categories [is] due to mining depletion. Increased RAR in the higher cost categories [is] due to new resources identified as the result of exploration activities (i. e. Arrow, Phoenix/Griffon, Triple R and Fox Lake deposits),” the report says. In Kazakhstan, RAR grew from 434.8 to 464.7 thousand tons on the back of exploration results, particularly at the deposits of Budennovskoye (sites 6 and 7), Inkai (sites 1 and 4), Muyunkum and North Kharasan (Kharasan 1).
In Niger, RAR decreased from 336.4 to 315.5 thousand tons, although resources grew from zero to 9.9 thousand tons in the cost category of up to USD 80/kgU and from 237.4 to 238.7 thousand tons in the category of up to USD 130/kgU, according to the authors of the report. In Namibia, RAR went down from 368.5 to 320.7 thousand tons across all categories due to mining depletion and reclassification and removal of ‘non-minable’ Rössing mine resources. In Russia, RAR decreased marginally, from 260 to 256.6 thousand tons, driven mostly by the depletion of resources at the existing mines.
In general, the report describes the situation with uranium resources as follows, “The most significant changes during this reporting period are observed in low-cost (
Most of lower-cost (
Exploration
The Red Book testifies to a dramatic reduction in uranium exploration expenditures. In 2014, exploration and mine development costs amounted to more than USD 2 billion, but already in 2015 fell by more than a half to USD 876.5 million. The cuts continued — in 2018, investments in exploration and development were about USD 500 million. Non-domestic investments decreased from USD 420 million in 2016 to USD 54 million in 2019 (preliminary data).
It should be made clear, though, that development accounts for most of the exploration and development costs. “China reported the development portion of total expenditures as 98 % and 97 % of total expenditures in 2015 and 2016 respectively, as the Husab mine was brought into production,” the report says. And while China’s CGNPC spent USD 378 million on the exploration and development of its Husab Mine in 2016, its expenditures decreased dramatically after the launch of the mine in the same year and amounted to USD 108 million in 2017, USD 41 million in 2018 and, according to preliminary data, USD 24 million in 2019.
It should be also noted that non-domestic investments in exploration and development include ‘in-country’ expenditures — this refers mostly to the data on Russia and China.
Canada, particularly the Athabasca Basin, remains a leader in terms of exploration. “Expenditures in Canada alone exceeded the total spending of the remaining top five countries,” the report reads.
Data on exploration and mine development expenditures in 2019 is incomplete because some of major producers, such as Australia and Canada, have not provided relevant information. The latest available data shows a 75 % decrease over the period from 2012 until 2018. “From 2016 to 2018, expenditures decreased in many countries, mainly because of persistently low uranium prices that slowed down many exploration and mine development projects,” the authors of the report explain.
Production
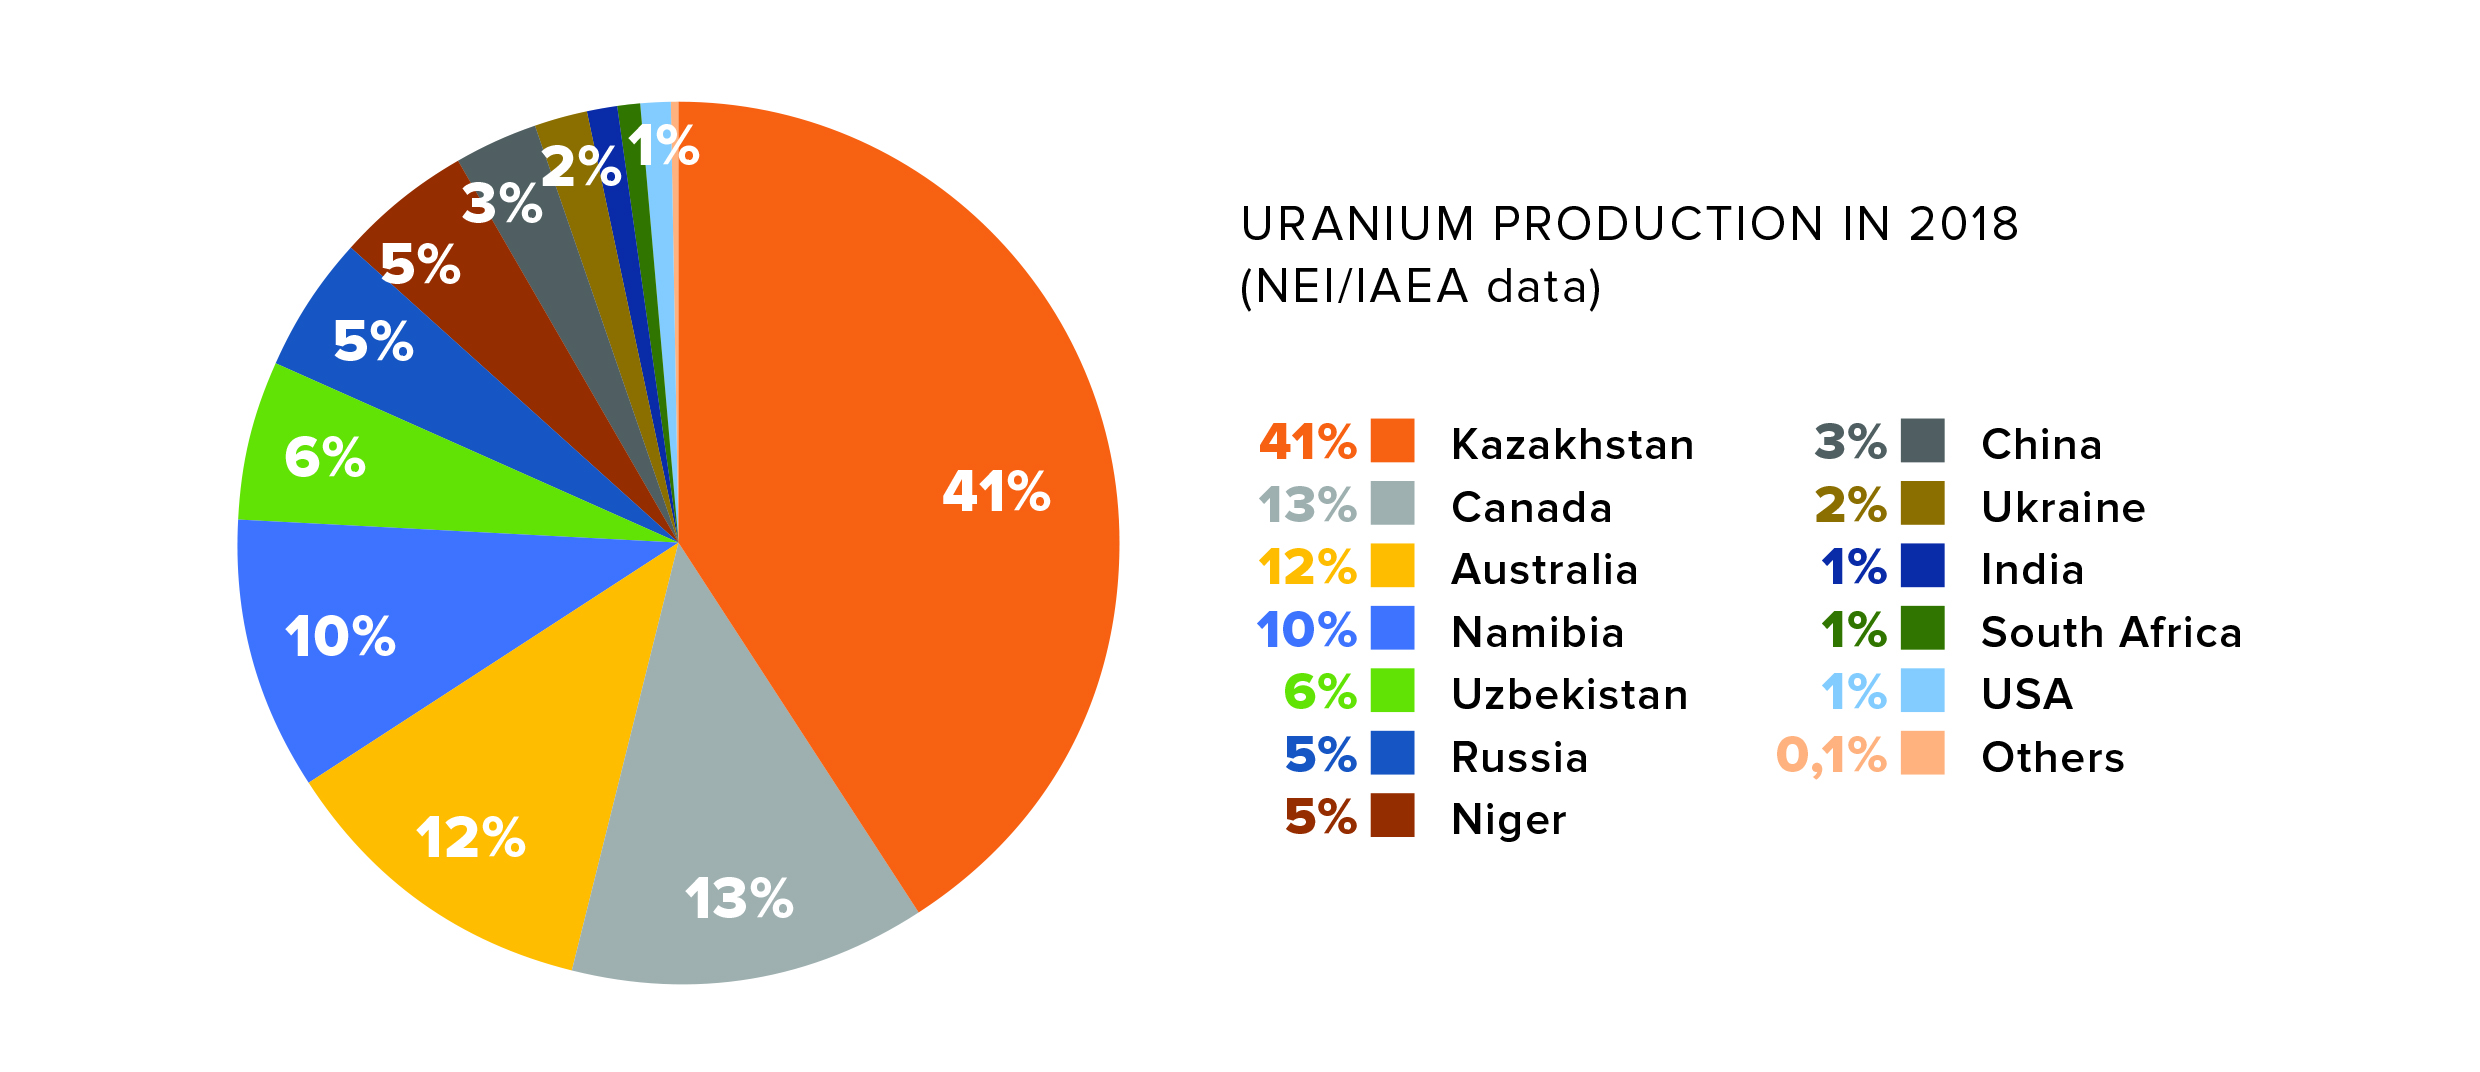
Kazakhstan has been a leader in uranium production for the last ten years. “Kazakhstan’s production alone in 2018 totaled more than the combined production in that year from Canada, Australia and Namibia, respectively the second, third and fourth largest producers of uranium,” the report says.
In general, production is decreasing globally. According to the report, almost 63,000 tons of uranium were produced in the world in 2016. The NEA and the IAEA estimated the production in 2019 to exceed 54,200 tons. Namibia was the only one of eight major producing countries to have increased the uranium output in 2016–2018. This was due to the launch of the Husab Mine and improvements in the ore grade at the Rössing Mine. In Canada, uranium production decreased twofold, from 14 to 7 thousand tons, following suspension of production at Rabbit Lake, McArthur River and Key Lake due to depressed uranium market prices. Production cuts in the USA were even more dramatic, from 979 tons of uranium in 2016 to 277 tons in 2018. The reason was the same — an extended period of low market prices. Kazakhstan’s Kazatomprom announced that it would also cut its uranium production. However, the cuts were expressed as percentage of the so-called subsoil use obligations. As a result, uranium production decreased in 2017 but then kept growing as those obligations were growing, too.
The report also accounts for the pandemic-caused reduction in the output in Kazakhstan and at the Rössing Mine, six months’ suspension of operations at Cigar Lake, and problems with delivering workers to the Ranger Mine in Australia. “At the time of writing, it is not clear how these temporary COVID‑19 induced restrictions on mining and milling will impact uranium production in 2020 and beyond. Clearly, 2020 production targets will not be achieved and the disruption caused by the pandemic could ripple through 2021, constricting global supply of newly mined uranium,” the report states.
Production expansion at existing mines and development of new mines will directly depend on the market, particularly prices, the possibility of rapidly resuming production at mothballed mines, and also whether the market perceives decommissioning of old mines as a threat to reliability of supply. “Since these sites span several stages of approvals, licensing and feasibility assessments, it can reasonably be expected that at least some will take several years to be brought into production, whereas others may never be. Notwithstanding the time it takes to bring new deposits into production, these new mine developments may be timely since longstanding, significant production centers in Australia (Ranger), Namibia (Rössing) and Niger (Cominak), with cumulative production capacity of 7,900 tU/year) are preparing for closure between early 2021 and the end of 2025.”
Demand
Even the leading global organizations fail to give a clear answer what trend the nuclear power industry will follow. According to the IAEA, there were 450 nuclear power plants with a total capacity of 396 GWe operating as of January 1, 2019. In order to supply them with fuel, 59,200 tons of uranium is needed every year. By 2040, the total installed capacity will either decrease to 354 GW (low scenario) or increase to 626 GW (high scenario). The demand for uranium will, respectively, go down to 56,640 tons or up to 100,225 tons by 2040. “Both short-term and long-term requirements are much more challenging to project following the accident at the Fukushima Daiichi NPP and the shift towards liberalization of electricity markets.”
The demand for uranium will also be influenced by such factors as installed capacity utilization and improvement in technologies that increase burn-up, extend the refueling interval and decrease uranium content in tailings.
Stock availability of uranium inventories is another important factor. There are no exact estimates of commercial uranium inventories, but they are known to decrease in Europe and the USA. “In the United States, as of 1 January 2019, total commercial inventories (utilities and producers stocks) were 50 200 tU, a 8 % decrease from the 54 488 tU of inventories held in 2017 (EIA, 2019)… In the European Union, uranium inventories held by utilities at the end of 2019 totaled 42 912 tU, enough for an average of three years’ fuel supply, a slight decrease of 5 % since the end of 2018 and a 17 % reduction since 2015.”
Finally, the demand for uranium might be affected by spent fuel refabrication. As you may know, the first commercial fuel assemblies containing mixed uranium plutonium oxide (MOX) fuel were loaded into the BN‑800 reactor of the Beloyarsk nuclear power plant (Russia) in 2020. Replacement of conventional fuel with MOX fuel in the BN‑800 reactor will be completed in 2022. Refabrication makes it possible to repeatedly use the initial material and reduces demand for natural uranium. However, this technology will begin to produce effects on the market only in the second half of the 21st century.
According to the Red Book experts, the identified low-cost (
It should be made clear that identified resources include both reasonably assured resources and inferred resources, which need to be confirmed yet. If we divide RAR by annual demand for uranium, we will see that these resources will suffice for approximately 22 year in the low-case scenario and 12 years in the high-case scenario. Yes, we should consider other sources as well. In 2018, uranium from mines accounted for 90 % of the total demand (95 % in 2017), but even in this case the extension will not exceed one or two years.
And even if we take an average term and assume that resources are not replaced at all, the industry will have 15 to 17 years until the existing resources are totally exhausted. Exploration continues at the existing mines, and depleted reserves are replaced with identified resources, so the total amount of resources will not change much. The key question is then as follows: how easy will it be to bring new resources into production? “Challenges remain with depressed market prices and other concerns in mine development include geopolitical factors, technical challenges and legal and regulatory frameworks,” the report summary says.
Prices
The spot price of uranium did not exceed USD 29 per pound of U3O8, while long-term prices balanced around USD 32 to USD 32.5 per pound.