In early April, the IAEA and the NEA published their joint Uranium 2022: Resources, Production and Demand report. Also known as the Red Book, it captures the results of 2020 and changes over the two years that passed since the previous edition and also analyzes more recent events having affected the uranium market. These include the energy crisis in Europe, supply chain disruptions, and a price increase to around USD 50–51 per pound of U3O8. All combined, they make it economically feasible to mine higher-cost reserves, thus securing nuclear fuel supply for up to 100 years.
The OECD and NEA global uranium industry report was due to be published in late 2022, but the publication was delayed. Despite the delay, the reporting year remained unchanged.
Resources
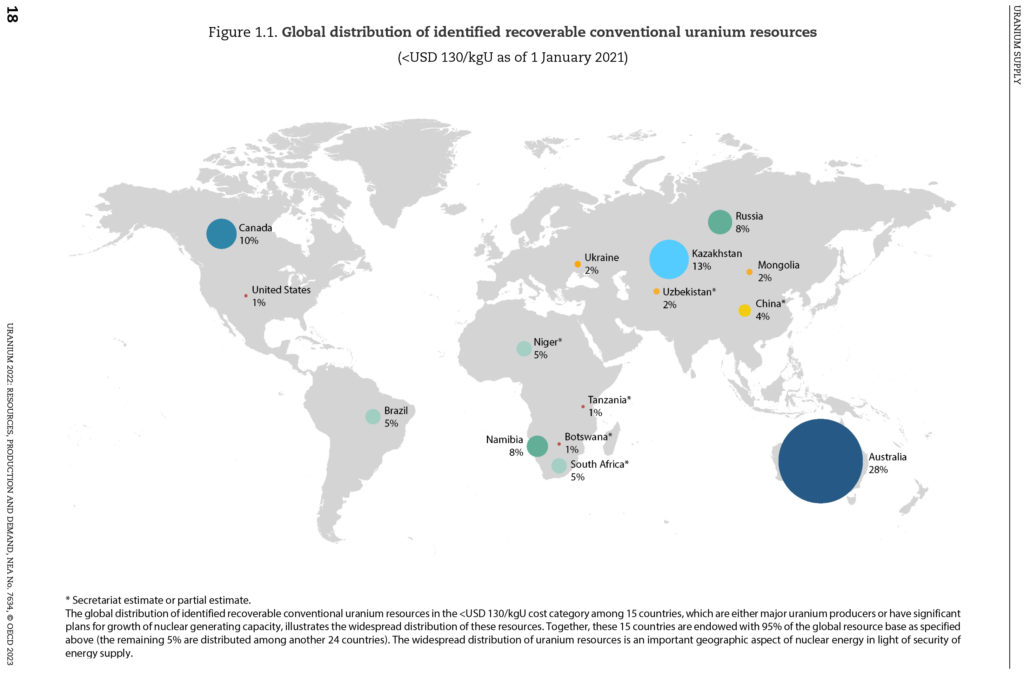
In 2019–2020, global uranium resources decreased by 2 % in contrast to an increase of about 1 % in the previous two years. Identified resources in the cost category of up to USD 260/kg of uranium (USD 100/lb U3O8), which also comprise lower production cost resources, decreased by 152,900 tons (1.9 %) from a little over 8 million tons of uranium to just under 7.92 million tons. The resources in the 3O8) cost category dropped the most, from nearly 1.1 million tons to little under 776,000 tons, down by 28.2 %. The 3O8) category demonstrated only a 0.8 % decline, while the resources in the 3O8) category decreased by 1.1 %.
The most dramatic decline occurred in reasonably assured resources (part of identified resources), with the “The decreases were primarily the result of mining depletion and cost category re-assignments of resources in Kazakhstan and Canada. Also contributing to decreases in these and other uranium producing countries were changes in cut-off grades, updated recoverability information, currency inflation effects and re-evaluations of previously identified uranium resources,” the authors of the report explain. In particular, the re-evaluation left Canada with no resources in the “since some countries do not report low-cost resource estimates, mainly for confidentiality concerns, whereas other countries that have never, or not recently, hosted uranium mining may be underestimating mining costs.”
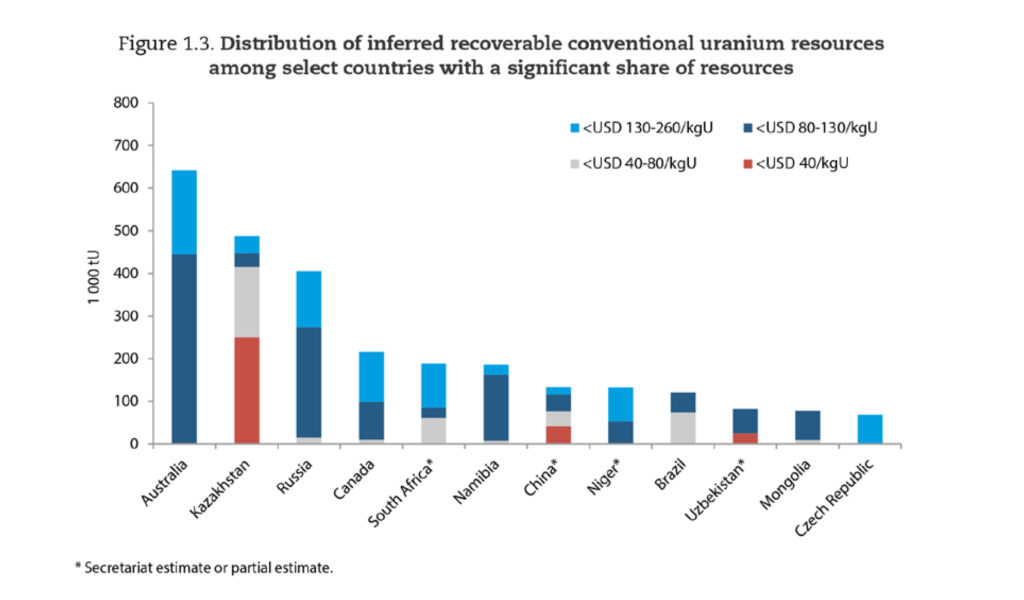
As for the resources in three higher-cost categories (USD 40 to USD 260/kg U), they decreased in Russia, Ukraine, Kazakhstan, and the Central African Republic. Resource estimates were revised in Mongolia, China, and Turkey. Guiana, Hungary, India, Malawi, Mauritania, Mongolia, Namibia, Niger and Paraguay reported increases in the same resource categories due to the ongoing exploration and new discoveries.
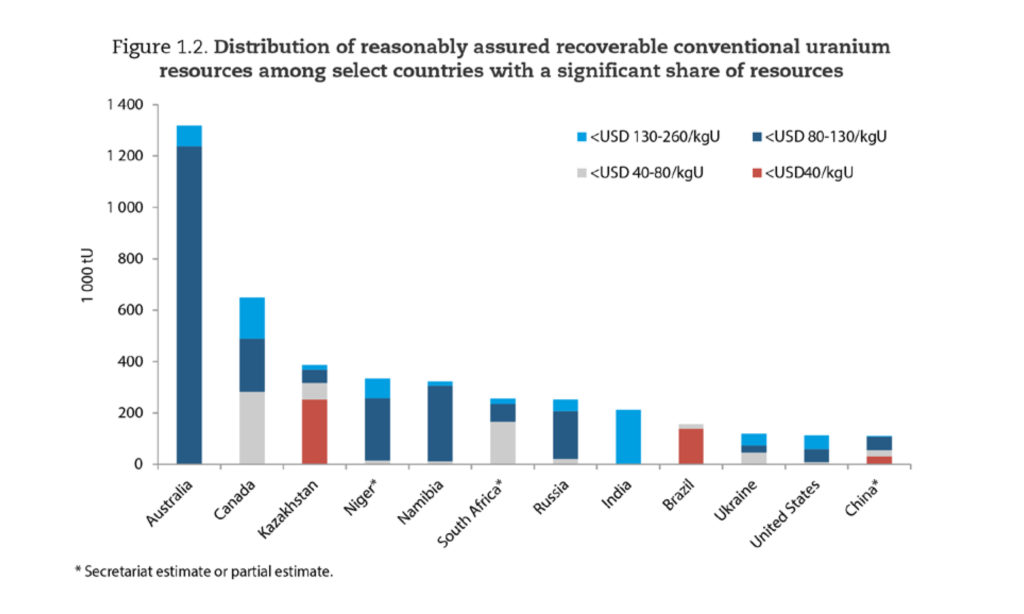
The lowest-cost category of reasonably assured recoverable resources is dominated by the ISL-amenable resources (291,560 tons out of 457,300 tons). The role of underground mining is growing in the three higher-cost categories: 549,600 tons out of 1.21 million tons in the
Exploration
Making reliable estimates of exploration costs is not an easy task as not every country shares the necessary data. “Several countries do not report non-domestic expenditures or have not reported these expenditures recently, and thus the data are incomplete. Private companies in Canada and Australia are known to make non-domestic investments and are likely leading investors in foreign uranium exploration and development activities, but no information has been reported by these governments for the past several years,” the authors of the report point out. Since 2008, only four countries (China, France, Japan, and Russia) have disclosed their non-domestic uranium exploration expenditures, but China has not reported this data for the current edition. In 2019 and apparently 2020, investments in foreign uranium exploration activities were at their lowest since at least 2014. That year, foreign exploration expenditures were nearly USD 801 million, having dropped 14 times to as little as USD 56.82 million in 2019.
Information about domestic exploration expenditures in 2019 and 2020 was updated by 19 countries. Compared to 2015, investment was down 71 %, from USD 876.5 million in 2015 to USD 251.3 million in 2020. However, the latter figure does not include China’s expenditures as the country has not reported this data for 2020. In 2019, China ranked second in terms of investment in domestic uranium exploration (USD 154 million).
Among 19 countries, Canada is the leader in uranium exploration expenditures, with USD 210.7 million invested in 2019 and USD 140.88 million in 2020. India ranked third in 2019 and second in 2020, having invested USD 66.17 million and USD 47.81 million, respectively. Total known expenditures worldwide amounted to USD 508.47 million in 2019 and USD 251.31 million in 2020.
The new edition of the Red Book features a table presenting drilling data by country. This data was reported by 15 countries, though by nine of them only in part. The table shows that only Namibia and Egypt increased their drilling activity in 2018–2021, while the rest of the countries either decreased it consistently or showed little change. The data, while fragmentary, still suggests a decline in drilling “on the global average” in the period under consideration.
In addition, the report presents information on uranium exploration and drilling expenditures in 2021. Even the preliminary and incomplete data still suggests that both more money was invested in uranium exploration and more meters drilled than a year before.
Demand
The existing 442 nuclear power reactors with a total installed capacity of 393 GWe need about 60.1 thousand tons of uranium per year (about 150 tons per 1 GW of capacity in operation). The low case scenario for the global nuclear power industry assumes that there will be 394 GW of installed capacity in operation by 2040. The high case scenario puts this figure at 677 GWe, up 70 % from 2020. Accordingly, demand for uranium will also grow to reach 63,000 tons per year in the low case and 108,200 tons in the high case. The biggest growth in installed capacity is expected in East, Central and South Asia, and in the Middle East. In Europe, nuclear capacity will remain at its current levels at best, dropping by a quarter in the low case scenario. Africa, Central and South America are expected to show modest growth. In North America, expectations range from a capacity reduction of 42 % to a 3 % growth from the 2020 levels.
Supply/Demand
This section of the Red Book answers the question of whether and for how long there is enough uranium to meet the needs of nuclear power plants.
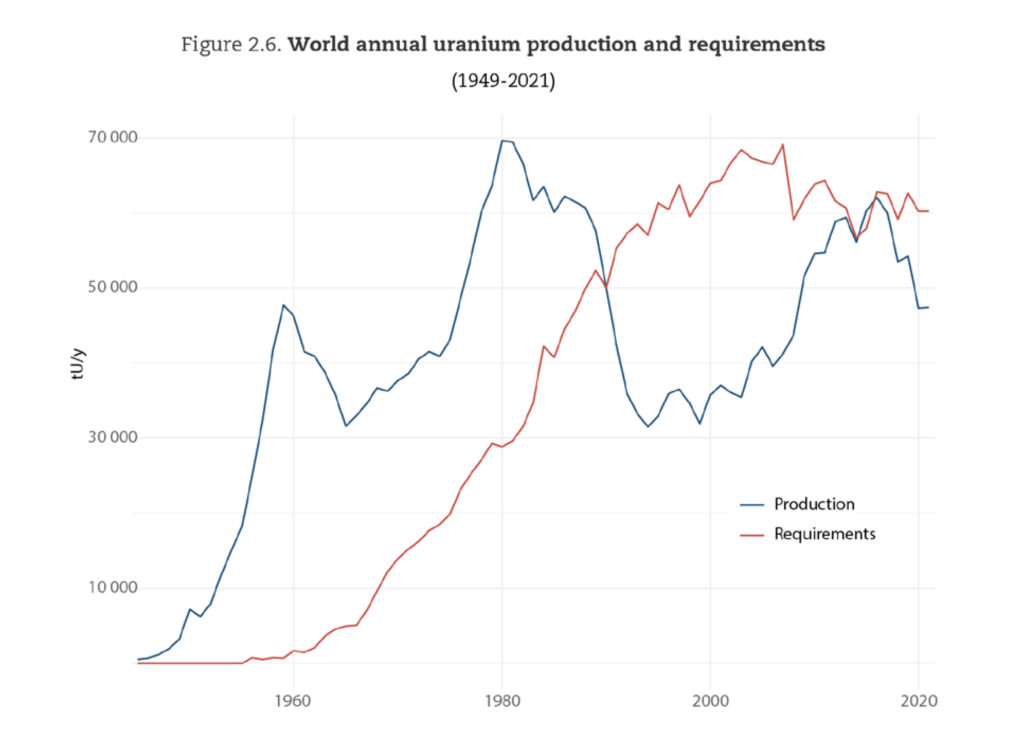
One of the trends noted by experts is that the share of natural uranium in total reactor needs is decreasing. For example, this share was 86 % in 2019, having dropped to 79 % in 2020. However, the declining production did not affect the supply of fuel for nuclear power plants. The shortage was covered by the so-called secondary supply. Such secondary supply includes excess government and commercial inventories, spent fuel reprocessing, underfeeding and uranium produced by the re-enrichment of depleted uranium tails, as well as low-enriched uranium produced by blending down highly enriched uranium. It is difficult to estimate such secondary supply since this information is not disclosed.
Another driver behind the increase in supply was the growth of prices to about USD 50/lb U3O8. Its impact was first felt after the two years in question but was taken into account in building a forecast for the period untill 2040. In addition, supply chain disruptions caused by the pandemic in 2020, the energy crisis in Europe in 2021, and the sanction pressure on Russia in 2022 made the buyers favor long-term contracts to secure uranium supplies. All these factors combined made it economically viable to produce uranium at a higher cost. While mining uranium for the nuclear fuel production used to make sense only at a cost of USD 40/kg to maximum USD 80/kg, now it is economically sound to produce uranium at a cost of up to USD 130/kg. According to the author’s estimates, if the price of uranium remained at the level of 2019–2020 (below USD 78/kg), 80 % of the identified recoverable resources in the “Hence, given those market and economic conditions, identified recoverable resources at a cost category of 3O8, the average price of uranium in early 2021) would be sufficient for only about 30 years of global reactor-related uranium requirements, considering 2020 uranium requirement figures. At average market prices of about USD 50/lb U3O8 (USD 130/kg U), beginning in mid‑2021 and sustained through the beginning of 2023, approximately 75 % of the recoverable resource base could be economically brought into production, representing about 100 years of uranium requirements,” the authors of the Red Book conclude.
They stress, though, it is not enough to only increase the price of uranium. We need timely investment in exploration, development and production and a high level of expertise to secure sufficient supply of uranium.
The rapidly changing political and economic environment has caused nations around the world to reconsider their attitude to nuclear power. “Noting that this was also due to the dramatic European energy crisis of 2022 brought by the shifting geopolitical situation, the 2024 edition of the Red Book will aim to provide a fuller picture of the implications of these developments on uranium demand and supply,” the authors promise.
Meanwhile, the ongoing changes benefit the nuclear energy industry: “After a period of reductions in uranium production, slowed investment and comparatively low prices, it remains to be seen whether the quickly evolving market and policy environment will provide incentives for the uranium market to expand substantially in the coming decades.”